
Logistic regression is a statistical model used to predict the probability of an event based on a set of independent variables. It’s particularly useful when you want to classify an event as belonging or not to a specific category (for example, whether a customer will buy a product or not, or whether a patient will develop a disease or not).
It is a Supervised Machine Learning algorithm that can be used to model the probability of a specific class or event. It is used when the data is linearly separable – that is, if there exists a line or plane that can be used to uniquely separate the data into different classes – and the outcome is binary or dichotomous. This means that logistic regression is typically used for binary classification problems (Yes/No, Correct/Incorrect, True/False, etc.),
In this post, I will demonstrate how to perform binomial logistic regression to create a classification model, in order to predict binary responses on a given set of predictors.
How logistic regression works and steps to build it
Logistic regression is a statistical modeling technique used to predict the probability of a binary event (e.g., yes/no, true/false) based on a set of independent variables.
Unlike linear regression, which is used to predict continuous values, logistic regression uses the logistic function to “model” the probability of the observed event.
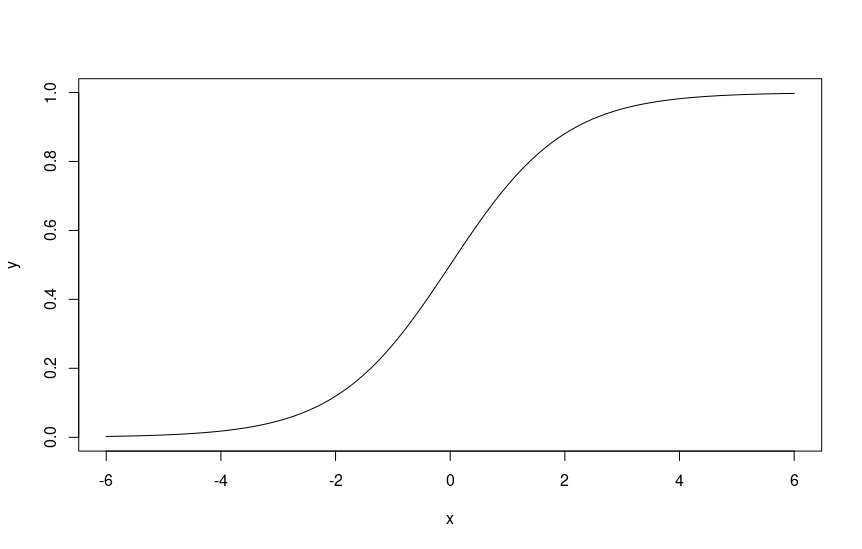
Logistic regression uses the logistic function, also known as the sigmoid, to produce the probability of an event.
The logistic function produces a value between 0 and 1, which can be interpreted as a probability.
After the model has been trained, it can be used to make predictions on new data, providing an estimate of the probability of an event.
The steps to build a logistic regression are as follows:
- Select and collect data: gather the data you want to use to predict the binary event and select the independent variables you believe are relevant to your analysis.
- Clean and prepare the data: check the data for any missing or erroneous values and ensure that the data is properly formatted for analysis.
- Build the model: use the logistic function to build the model on the training data. The logistic function is an S-shaped function that returns values between 0 and 1, which can be interpreted as probabilities.
- Evaluate the model: Use the test data to evaluate the accuracy of the model. There are various metrics that can be used for evaluation, such as accuracy, precision, and recall.
- Interpret the results: analyze the model coefficients to understand the relative importance of the independent variables and to better understand how the values of the variables affect the probability of the event.
- Use the model to make predictions: use the model to make predictions on new data based on the provided independent variables.
These are obviously the general steps for building a logistic regression. However, in some situations, it may be necessary to perform additional operations or adjustments, such as using regularization methods to avoid overfitting problems, or using cross-validation to have a more reliable estimate of the model’s accuracy.
An example in R: calculating the probability of survival on the Titanic
To make a very simplified practical example, I downloaded one of the most well-known and used datasets, the one related to the Titanic passengers, which contains information about the passengers of the famous Titanic shipwreck, including age, gender, social class, and whether the passengers survived the accident or not.
I got it from this address and saved it locally as titanic.csv
Note: the Titanic dataset is also available in the Kaggle data library (kaggle.com) and in the UCI Machine Learning dataset collection (archive.ics.uci.edu/ml/datasets.php).

I don’t need to clean the data in this case because I’m using a “safe” and extensively tested dataset.
Obviously, in a “real” use case, the data would need to be carefully examined, studied, and “processed” in the preliminary phase…
Here’s an example code in R:
# Load libraries
library(ggplot2)
library(caret)
# Load data into the titanic dataset
# Replace the path with the one on your PC
titanic <- read.csv("/mypath/titanic.csv")
# Display the first 10 rows
head(titanic, 10)
# Create dummy variables for categorical fields
titanic$Sex <- as.factor(titanic$Sex)
titanic$Survived <- as.factor(titanic$Survived)
# Create a logistic regression model
model <- glm(Survived ~ Pclass + Sex + Age + SibSp + Parch + Fare + Embarked, data = titanic, family = binomial(link = "logit"))
# Show the model
summary(model)
# How to predict the probability of survival for an example case
example <- data.frame(Pclass = 3, Sex = "male", Age = 32, SibSp = 0, Parch = 0, Fare = 8.05, Embarked = "S")
predict(model, newdata = example, type = "response")
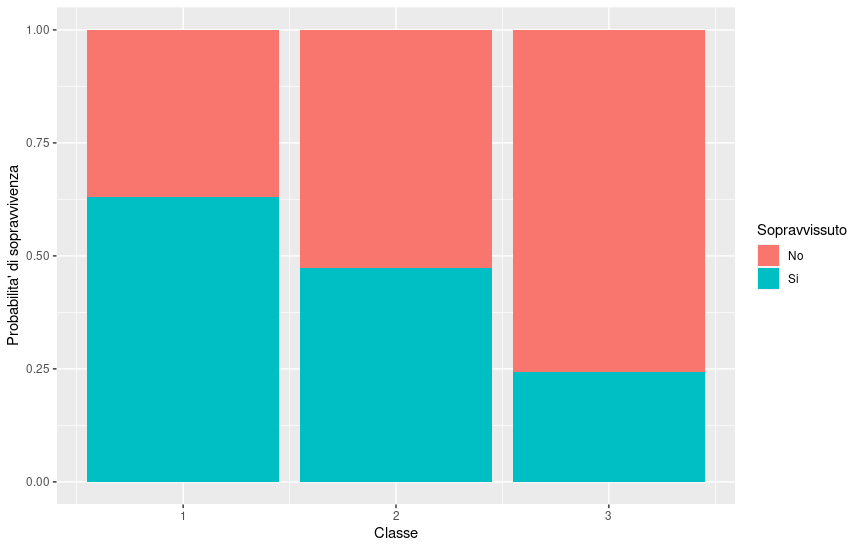
# Graphically display the probabilities of survival based on class
ggplot(titanic, aes(x = Pclass, fill = factor(Survived))) +
geom_bar(position = "fill") +
labs(x = "Class", y = "Probability of survival") +
scale_fill_discrete(name = "Survived", labels = c("No", "Yes"))
In this case, we notice that a 32-year-old man in third class would have had about an 8.5% chance of survival.
Graphically, we then have a way to visualize the probability of survival based on the class of the seat.
A bit of math: the logit equation
As we have seen, the logit equation is a mathematical equation used in logistic regression to describe the relationship between the dependent variable (which can only take binary values) and one or more independent variables (also called predictors or covariates).
In general, the form of the logit equation is as follows:
where:
p is the probability that the dependent variable takes the value “1”
logit(p) is called the log-odds
b_0, b_1, b_2, …, b_n are the model coefficients (also called weights or parameters)
x_1, x_2, …, x_n are the independent variables (predictors or covariates)
In summary, the logit equation describes how the probability of an event (e.g., a binary response) depends on the values of the independent variables, through the model weights.
Let’s sum up
Logistic regression is a powerful statistical model that can help predict the outcome of an event based on a set of independent variables. It’s easy to use and interpret, and can be used in many fields, from medicine to finance.
It represents an effective tool for solving binary classification problems because it allows modeling the relationship between the binary dependent variable and one or more independent variables.
It allows you to:
- Model the relationship between a binary dependent variable and one or more independent variables.
- Predict the probability that the dependent variable will take a specific value (e.g., 1 or 0) based on the values of the independent variables.
- Use these probability predictions to classify new cases based on a predefined threshold (for example, if the probability of a case being classified as 1 is greater than 0.5, then it is classified as 1, otherwise as 0)
- Interpret the model weights (coefficients) to understand which independent variables are most important for classification.